
 万万没想到
万万没想到前言
简介
SysBench 是一个基于 LuaJIT 的可编写多线程基准测试工具。它最常用于数据库基准测试,但也可用于创建不涉及数据库服务器的任意复杂工作负载。并且提供多平台支持,如Linux、Windows(1.0版本后已删除支持)、Macos,Fedora、Debian等其他平台也可以通过源码编译安装。
特性:
- 提供大量的速率和延迟的统计数据,包括延迟的百分比和柱状图。
- 即使有成千上万的并发线程,开销也很低。sysbench能够每秒产生和跟踪数以亿计的事件。
- 通过在用户提供的Lua脚本中实现预定义的钩子,可以轻松创建新的基准。
- 也可以作为一个通用的Lua解释器,只需在你的脚本中用#!/usr/bin/sysbench替换#!/usr/bin/lua。
本次测试采用GitHub上的最新版安装包,版本号为1.0.20
操作系统版本采用 CentOs7.6 x86_64
测试的数据库:MySQL。
软件安装
Linux
网络安装(yum)
- RHEL/CentOS:
curl -s https://packagecloud.io/install/repositories/akopytov/sysbench/script.rpm.sh | sudo bash
sudo yum -y install sysbench
- Debian/Ubuntu:
curl -s https://packagecloud.io/install/repositories/akopytov/sysbench/script.deb.sh | sudo bash
sudo apt -y install sysbench
离线安装(源码编译安装)
GitHub下载源码包:https://github.com/akopytov/sysbench/tags
依赖环境安装:
- RHEL/CentOS:
    yum -y install make automake libtool pkgconfig libaio-devel
    yum -y install mariadb-devel openssl-devel
    yum -y install postgresql-devel
- Debian/Ubuntu:
    apt -y install make automake libtool pkg-config libaio-dev
    apt -y install libmysqlclient-dev libssl-dev
    apt -y install libpq-dev
编译安装:
    ./autogen.sh
    ./configure
    make -j 6        #-j参数可加规定多少线程同时编译
    make install
使用方法介绍
sysbench测试三部曲:
prepare -> run -> cleanup
准备数据(prepare):
例:sysbench /usr/share/sysbench/oltp_read_write.lua –tables=10 –table_size=100000 –mysql-user=root –mysql-password=123123 –mysql-host=127.0.0.1 –mysql-port=3306 –mysql-db=sysbench_test prepare
测试数据(run):
例:sysbench /usr/share/sysbench/oltp_read_write.lua –tables=10 –table_size=100000 –mysql-user=root –mysql-password=123123 –mysql-host=127.0.0.1 –mysql-port=3306 –mysql-db=sysbench_test run
清理测试数据(cleanup):
例:sysbench /usr/share/sysbench/oltp_read_write.lua –tables=10 –table_size=100000 –mysql-user=root –mysql-password=123123 –mysql-host=127.0.0.1 –mysql-port=3306 –mysql-db=sysbench_test cleanup
参数解读
# –tables 生成的数据表数
# –table_size 表中数据行数
# –mysql-db 将要生成测试数据的数据库名
# –threads: 表示线程数
# –time: 表示执行时间
# –mysql-host: 指定数据库IP地址
# –report-interval: 表示间隔多少秒输出测试信息
# –mysql-db: 指定测试的数据库
# run : 表示运行测试
# prepare: 准备测试数据
# cleanup: 清理测试数据
测试环境准备
MySQL 5.7
本次测试采用CentOS7.6系统,配置为1C 2G,安装MySQL5.7社区版测试。
测试环境准备
MySQL安装与配置
- 配置MySQL yum源
wget wanpeng.life/rpm/mysql80-community-release-el7-3.noarch.rpm
下载MySQL yum源安装包,执行 rpm -ivh mysql80-community-release-el7-3.noarch.rpm
即可成功添加源,编辑/etc/yum.repos.d/mysql-community.repo文件,将测试所需要版本的MySQL源启用,enabled=0为关闭状态,改为enabled=1即为启用。
- 安装
yum install mysql
mysql -V 检验版本,以免误安装为mariadb。
- 启动、初始化配置
[root@wanwan ~]# systemctl start mysqld
[root@wanwan ~]# mysql_secure_installation   #初始化MySQL
- 登录MySQL并创建测试库
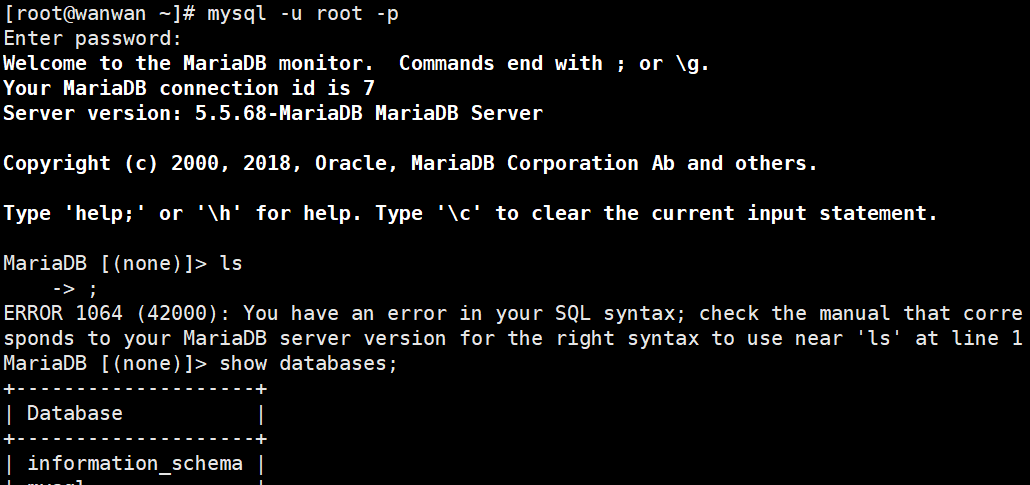
[root@wanwan ~]# mysql -u root -p 123123
mysql> create database sysbench_test;
sysbench生成测试数据
- 查找sysbench自带的数据生成脚本
find / -name oltp*.lua
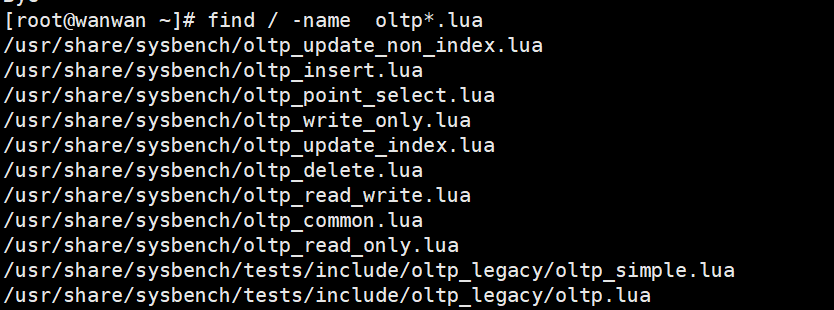
各个脚本的测试用途:
oltp_read_write:测试数据库的总和读写tps
oltp_read_only:测试数据库的只读性能
oltp_delete: 测试数据库删除性能
oltp_update_index:测试数据库更新索引字段等的性能
oltp_insert: 测试数据库数据插入性能
oltp_write_only:测试数据库的写入性能
oltp_point_select:测试数据库的查询性能
- 生成测试数据库数据
sysbench /usr/share/sysbench/oltp_read_write.lua --tables=10 --table_size=100000 --mysql-user=root --mysql-password=123123 --mysql-host=127.0.0.1 --mysql-port=3306 --mysql-db=sysbench_test prepare
执行测试任务
sysbench /usr/share/sysbench/oltp_read_write.lua --mysql-user=root --mysql-password=123123 --mysql-host=127.0.0.1 --mysql-port=3306 --mysql-db=sysbench_test --tables=10 --table_size=100000 --threads=10 --time=30 --report-interval=3 run
测试结果数值解读
Threads started!

SQL statistics:
    queries performed:
        read:                            928998					#读总数
        write:                           265428					#写总数
        other:                           132714					#其他操作总数(如COMMIT等操作)
        total:                           1327140				#全部总数和
    transactions:                        66357  (552.79 per sec.)			#每秒事务数(tps)
    queries:                             1327140 (11055.82 per sec.)	#查询总数(qps)
    ignored errors:                      0      (0.00 per sec.)	#忽略错误数
    reconnects:                          0      (0.00 per sec.) #重新连接数

General statistics:
    total time:                          120.0386s  #总耗时
    total number of events:              66357			#总发生事务数

Latency (ms):
         min:                                    4.75		#最小耗时
         avg:                                   36.18		#平均耗时
         max:                                  316.73		#最大耗时
         95th percentile:                       65.65		#95%的请求时间为65.65
         sum:                              2400496.45

Threads fairness:
    events (avg/stddev):      3317.8500/11.07 #平均每个线程完成envet的次数,后一个值是标准差
    execution time (avg/stddev):   120.0248/0.00 #平均每个线程平均耗时,后一个值是标准差
主要参考结果参数:
transactions: 每秒事务总数(tps)
queries: 每秒查询总数 (qps)
95th percentile: 前95%的请求的最大响应时间
清除测试数据
sysbench /usr/share/sysbench/oltp_read_write.lua --mysql-user=root --mysql-password=123123 --mysql-host=127.0.0.1 --mysql-port=3306 --mysql-db=sysbench_test --tables=10 --table_size=100000 --threads=10 --time=30 --report-interval=3 cleanup
测试方案
1. 线程数对TPS和QPS的影响
测试线程数对TPS和QPS的影响,所以将测试线程数定为1,2,4,8,16,32,64,128,256分别测试,测试结果绘制出折线图观察变化情况。
1.1 首先生成测试文件:
sysbench /usr/share/sysbench/oltp_read_write.lua --mysql-user=root --mysql-password=123123 --mysql-host=127.0.0.1 --mysql-port=3306 --mysql-db=sysbench_test --tables=10 --table_size=500000 --threads=10 --time=60 --report-interval=3 prepare
1.2 编写测试脚本:
#!/bin/bash
for i in {1,2,4,8,16,32,64,128,256}
do
sysbench /usr/share/sysbench/oltp_read_write.lua --mysql-user=root --mysql-password=123123 --mysql-host=127.0.0.1 --mysql-port=3306 --mysql-db=sysbench_test --tables=10 --table_size=500000 --threads=$i --time=60 --report-interval=3 run
done
1.3 正式测试将结果输出到 thread.log文件中,方便关键数据取出。
bash thread.sh > thread.log
!!!
发现测试进程在线程为256时终止报错,经查阅,是由于MySQL默认的最大线程数和最大连接数已经不满足我们的测试。
!!!
解决办法:
修改/etc/my.cnf 文件
添加如下参数:
max_connections=40960
max_prepared_stmt_count=199999
以上数值为本着越大越好随意修改。
重启MySQL:systemctl restart mysqld
重试解决。
1.4 取出测试结果中的关键数据。
cat thread.log | grep transactions: | awk ‘{print $3}’
cat thread.log | grep queries: | awk ‘{print $3}’
1.5 结果图:
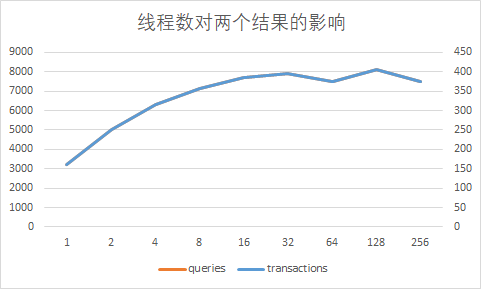
结论:发现在32线程以后tps和qps达到上限水平,之后更高线程的测试结果浮动不大,但通过观察cpu占用情况,发现并没有满载,可能是达到磁盘IO上线。
2. 长时间高负载数据库的稳定性
测试命令:
sysbench /usr/share/sysbench/oltp_read_write.lua --mysql-user=root --mysql-password=123123 --mysql-host=127.0.0.1 --mysql-port=3306 --mysql-db=sysbench_test --tables=10 --table_size=500000 --threads=32 --time=300 --report-interval=5 run > runtime.log
取出关键数据:
cat runtime.log | grep tps: | awk ‘{print $2}’
cat runtime.log | grep tps: | awk ‘{print $7}’
cat runtime.log | grep tps: | awk ‘{print $9}’
结果图:
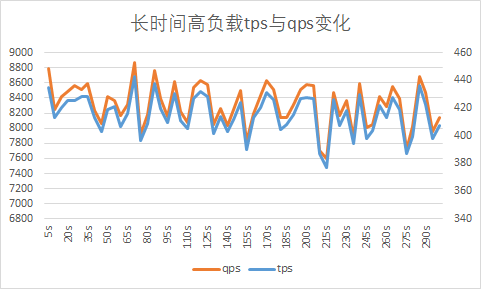
结论:
3. 多表少数据和少表多数据对数据库性能是否有影响
创建多表少数据环境
创建10000张表,每条表中插入500行数据。
sysbench /usr/share/sysbench/oltp_read_write.lua --mysql-user=root --mysql-password=123123 --mysql-host=127.0.0.1 --mysql-port=3306 --mysql-db=sysbench_test --tables=10000 --table_size=500 --threads=32 --time=120 --report-interval=5 prepare
!!!报错,FATAL: Worker threads failed to initialize within 30 seconds! !!!
工作的线程不能在30秒内初始化
我理解的原因是因为数据表的数量过多,本地环境cpu等硬件配置不够,导致30秒内无法创建10000张表和每条表中插入500行数据的sql语句并执行完成。
测试命令:
sysbench /usr/share/sysbench/oltp_read_write.lua --mysql-user=root --mysql-password=123123 --mysql-host=127.0.0.1 --mysql-port=3306 --mysql-db=sysbench_test --tables=10000 --table_size=500 --threads=32 --time=120 --report-interval=3 run
本地跑不起来······如实际测试时还是会有相同问题,将降低表的数量在尝试。
Oracle 19.3
测试环境准备
Oracle安装准备
下载地址:https://www.oracle.com/database/technologies/oracle-database-software-downloads.html
本次测试采用rpm包安装模式,系统为centos7.6最小化安装
安装准备:
关闭selinux getenforce 0
关闭防火墙 systemctl stop firewalld
配置epel源 wget -O /etc/yum.repos.d/epel.repo http://mirrors.aliyun.com/repo/epel-7.repo
配置Oracle源 wget -O /etc/yum.repos.d/Oracle.repo http://public-yum.oracle.com/public-yum-ol7.repo
Oracle安装步骤
- 将oracle-database-ee-19c-1.0-1.x86_64 .rpm上传至服务器
- 执行
rpm -ivh oracle-database-ee-19c-1.0-1.x86_64\ \(1\).rpm
报错:依赖检测失败:
oracle-database-preinstall-19c 被 oracle-database-ee-19c-1.0-1.x86_64 需要
- 安装oracle-database-preinstall-19c包 执行:
yum install -y oracle-database-preinstall-19c
- 再次执行
rpm -ivh oracle-database-ee-19c-1.0-1.x86_64\ \(1\).rpm
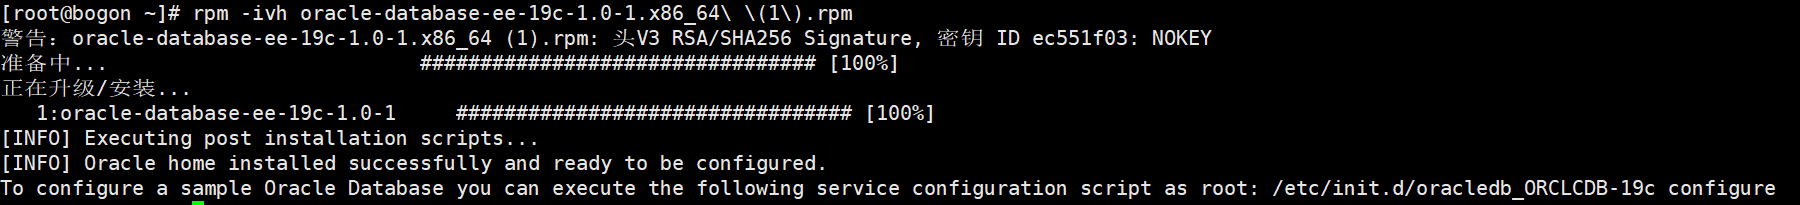
安装成功
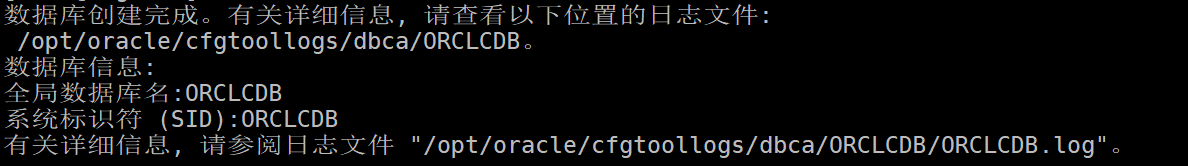
- 创建数据库
/etc/init.d/oracledb_ORCLCDB-19c configure
注:RPM安装默认的数据文件路径是/opt/oracle/oradata目录,确保空间充足。
- 经过漫长的等待
- 切换到oracle用户(rpm安装会自动创建oracle用户)
su -oracle
- 添加环境变量
cat >> ~/.bashrc << EOF
export ORACLE_BASE=/opt/oracle
export ORACLE_HOME=/opt/oracle/product/19c/dbhome_1
export ORACLE_SID=ORCLCDB
export PATH=$ORACLE_HOME/bin:$PATH:$HOME/.local/bin:$HOME/bin
EOF
source /home/oracle/.bash_profile
注:添加环境变量位置
全局:/etc/profile
用户:~/.bashrc
添加完成后: source + 上方的文件路径 生效
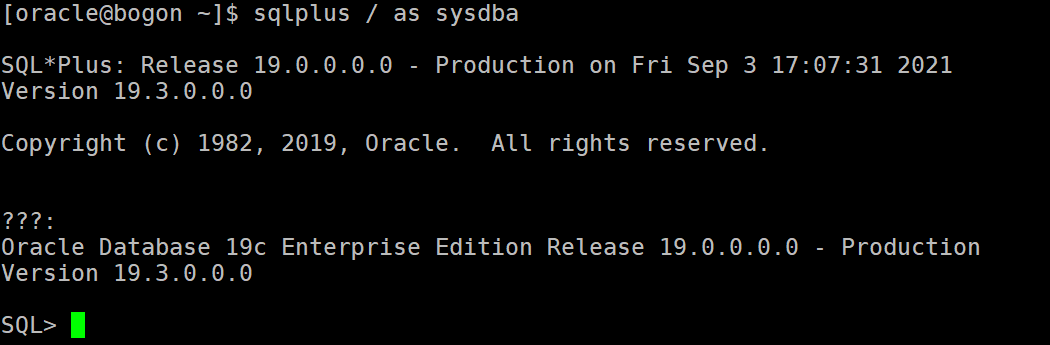
- 测试安装是否成功
sqlplus / as sysdba
- 执行查询测试
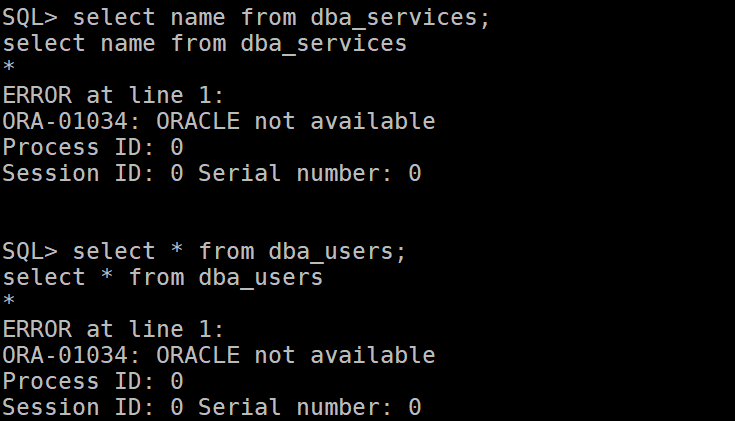
报错。
ERROR at line 1:
ORA-01034: ORACLE not available
解决办法:
SQL> startup mount;
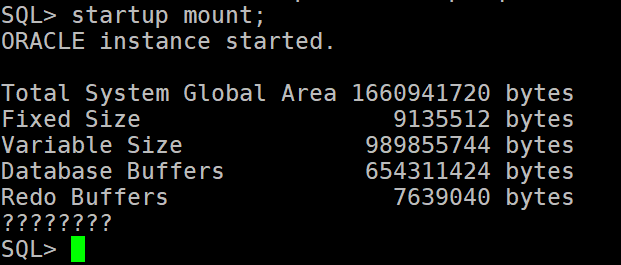
SQL> shutdown
SQL> startup
重新执行查询:
SQL> select * from user_users;
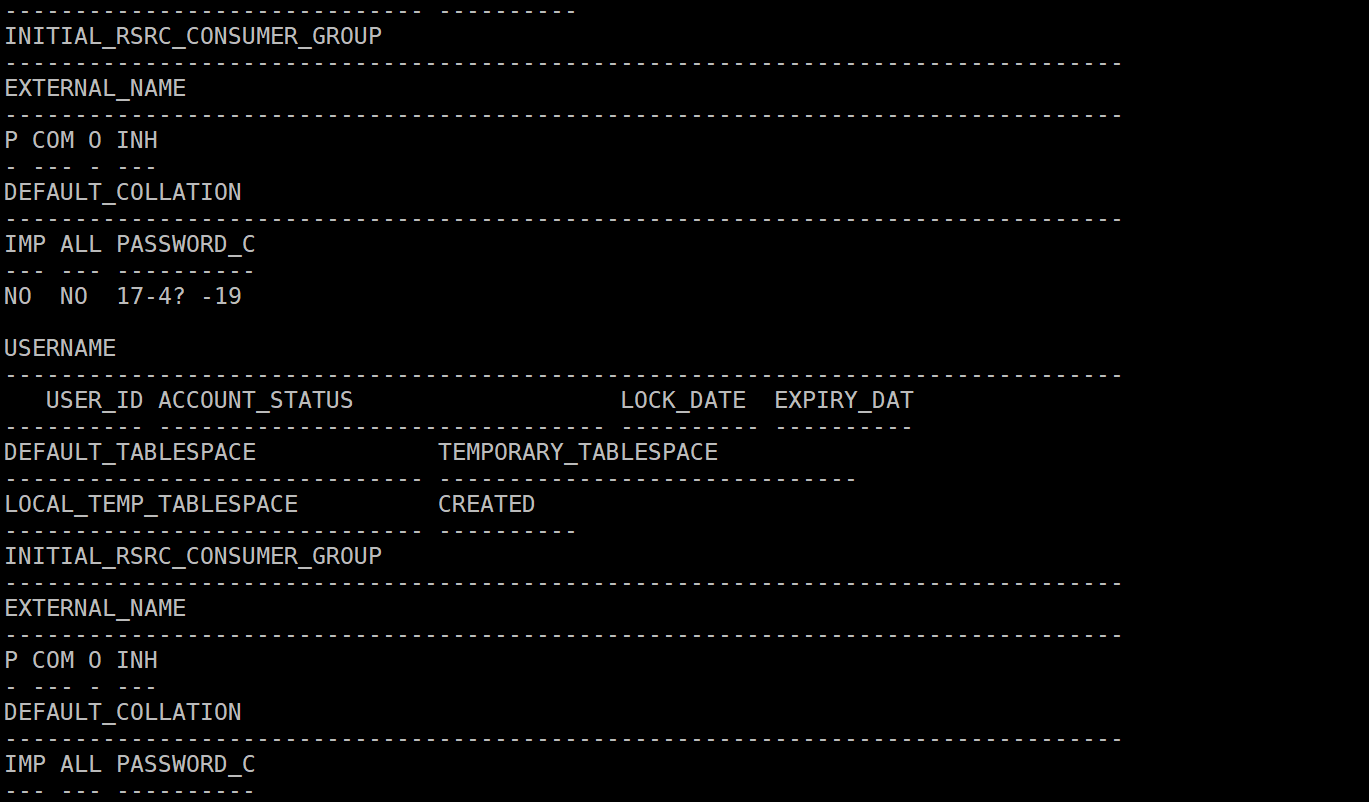
就此环境准备成功!
Oracle创建测试用户
- 首先登录sysdba账户
sqlplus / as dba
- 执行创建用户语句
CREATE USER c##sysbench IDENTIFIED BY 123456789;
- 授予sysbench用户权限
GRANT CONNECT, RESOURCE, DBA TO c##sysbench;
Oracle普通用户登录方式
sqlplus
交互状态输入用户名密码
Oracle乱码问题

在功能正常后,会发现在执行sql语句过程中,数据或提示会大概率的出现乱码。
造成此现象的原因:
操作系统与服务器一致,但客户端与服务器字符集不一致
客户端与服务器一致,但操作系统与服务器不一致
解决方法:
将操作系统、服务器和客户端统一使用 en_US.UTF-8 英文字符集。
具体操作方法:
- 更换操作系统字符集
vi /etc/locale.conf 修改 LANG=”en_US.UTF-8″
- 编辑Oracle用户环境变量
su – oracle
vi .bash_profile #加入以下内容:
LANG=zh_CN.UTF-8; export LANG
NLS_LANG=’AMERICAN_AMERICA.AL32UTF8′; export NLS_LANG
source .bash_profile #重载此文件
- 登录验证
sqlplus / as sysdba
SQL>select userenv(‘language’) from dual
问题解决。
sysbench安装步骤
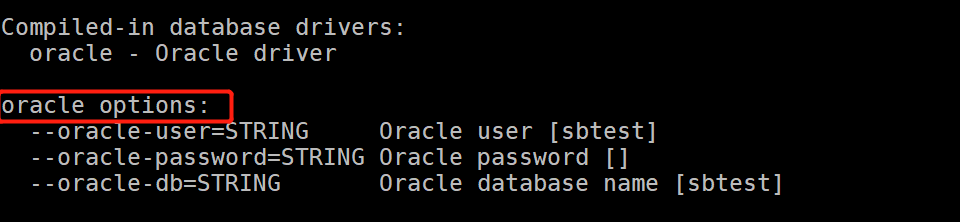
现在GitHub上最新的sysbench版本为1.0.20,但在0.5之后的版本就不支持对Oracle的测试,所以需下载0.5之前的版本进行测试。
由于sysbench默认的引擎是mysql,所以我们这个编译安装的时候需要指定安装的引擎为oracle
- 解压sysbench包
- 进入到sysbench目录
- 安装编译安装所需工具
yum -y install make m4 autoconf automake libtool pkgconfig libaio-devel
- 配置临时环境变量
export CC=cc
export CXX=c++
export CFLAGS=”-m64 -I /opt/oracle/product/19c/dbhome_1/rdbms/public/”
export CXXFLAGS=”$CFLAGS”
export ORACLE_HOME=/opt/oracle/product/19c/dbhome_1
export LD_LIBRARY_PATH=/opt/oracle/product/19c/dbhome_1/lib
- 运行autogen.sh,生成configure目录
./autogen.sh
- 编译参数配置
./configure –prefix=/usr/local/sysbench –with-oracle –libdir=/opt/oracle/product/19c/dbhome_1/lib –without-mysql
- 编译,需要加上Oracle的这个动态库文件
make ORA_LIBS=/opt/oracle/product/19c/dbhome_1/lib/libclntsh.so
- 编译安装
make install
echo $? #如输出为0表示安装成功,无报错
- 添加sysbench环境变量
echo “export PATH=$PATH:/usr/local/sysbench/bin”>>/etc/profile
source /etc/profile
- 执行
sysbench –help
安装成功。
附:
sysbench其他实用功能
- cpu测试:
sysbench cpu –threads=3 run
参数:
–cpu-max-prime: 素数生成数量的上限
–time: 运行时长,单位秒
–threads: 线程数
测试结果样例:
[root@wanwan ~]# sysbench cpu --threads=2 run
sysbench 1.0.20 (using bundled LuaJIT 2.1.0-beta2)

Running the test with following options:
Number of threads: 2   #线程数
Initializing random number generator from current time

Prime numbers limit: 10000

Initializing worker threads...

Threads started!

CPU speed:
    events per second:  1068.41   #每秒处理事件数

General statistics:
    total time:                          10.0004s    #测试时间
    total number of events:              10686			#共发生的事件数

Latency (ms):
         min:                                    0.91		时间执行的最小时间
         avg:                                    1.87		平均时间
         max:                                   22.92		最大时间
         95th percentile:                       11.24		95%事件均在1.64毫秒内完成
         sum:                                19979.27

Threads fairness:
    events (avg/stddev):    5343.0000/4.00	#两个线程的标准方差为12.50,该值越小,说明越稳定
    execution time (avg/stddev):   9.9896/0.00	#每个线程平均执行总时间
- 内存测试:
sysbench –test=memory –threads=1 –memory-block-size=8k –memory-block-size=100G —memory-block-size=seq run
参数:
–memory-block-size=SIZE #用于测试的内存块大小 [1K]
–memory-total-size=SIZE #要传输的数据总大小 [100G]
–memory-scope=STRING #内存访问范围 {global,local} [global]
–memory-hugetlb[=on|off] #从 HugeTLB 池中分配内存 [off]
–memory-oper=STRING #类型的内存操作 {read, write, none} [write]
–memory-access-mode=STRING #内存访问模式 {seq,rnd} [seq]
测试结果样例:
[root@wanwan ~]# sysbench --test=memory --threads=2 --memory-block-size=8k --memory-total-size=100G --memory-access-mode=seq run
WARNING: the --test option is deprecated. You can pass a script name or path on the command line without any options.
sysbench 1.0.20 (using bundled LuaJIT 2.1.0-beta2)

Running the test with following options:
Number of threads: 2
Initializing random number generator from current time

Running memory speed test with the following options:
  block size: 8KiB
  total size: 102400MiB
  operation: write
  scope: global

Initializing worker threads...

Threads started!

Total operations: 13107200 (1506365.92 per second)

102400.00 MiB transferred (11768.48 MiB/sec)

General statistics:
    total time:                          8.6999s
    total number of events:              13107200

Latency (ms):
         min:                                    0.00
         avg:                                    0.00
         max:                                   27.17
         95th percentile:                        0.00
         sum:                                13837.80

Threads fairness:
    events (avg/stddev):           6553600.0000/0.00
    execution time (avg/stddev):   6.9189/0.09
- 线程测试(测试服务器对threads的调度):
sysbench threads –thread-yields=100 –thread-locks=2 run
参数:
–thread-yields=N 每个请求要做的产量数
–thread-locks=N #每个线程的锁数
测试结果示例:
[root@wanwan ~]# sysbench  threads --thread-yields=100  --thread-locks=2 run
sysbench 1.0.20 (using bundled LuaJIT 2.1.0-beta2)

Running the test with following options:
Number of threads: 1
Initializing random number generator from current time

Initializing worker threads...

Threads started!

General statistics:
    total time:                          10.0001s
    total number of events:              543472

Latency (ms):
         min:                                    0.02
         avg:                                    0.02
         max:                                    3.02
         95th percentile:                        0.02
         sum:                                 9909.17

Threads fairness:
    events (avg/stddev):           543472.0000/0.00
    execution time (avg/stddev):   9.9092/0.00


评论前必须登录!
立即登录 注册